
About the Collaborative
This collaboration between UTHealth Houston School of Public Health and The University of Texas MD Anderson Cancer Center (MD Anderson) is a part of the UTHealth Houston and MD Anderson Population Health Collaborative.
The environment and context where individuals live, work and play are increasingly recognized as key factors for overall health and wellness, including the risk of chronic disease. Within the last decade, emergent technological capacity in Geographic Information Systems (GIS) and geospatial data science has resulted in a growing research community developing and applying geospatial approaches in health research and practice.
The Joint Collaborative on Geospatial Analysis & Health (JCoGA&H) was created to conduct and deploy focused geospatial analysis to:
- Build consensus on shared strategic impact priorities in population health and health equity
- Enhance access to spatial analysis essential to research, policy analysis, and public health practice
- Directly enable researchers, public health practitioners, and community-based organizations in Greater Houston, across the State of Texas, and nationally to utilize spatial analysis to improve and inform their work in population health
- Democratize geospatial data to generate synergy in geospatial data science to improve population health and address health disparities
Core Functionalities
- Provide state-of-the-art geospatial data analysis and visualization expertise to support chronic disease prevention and control research and practice
- Provide customized geospatial support to community-based organizations and build community capacity in geospatial technology
- Establish the strategic and operational structure for a best-in-class strategic resource core in geospatial data analysis and visualization
How to get involved
If you are interested working with us or in receiving spatial analysis consultation, please contact [email protected]. For those interested in collaboration, please complete this survey.
Meet our Team
JCoGA&H brings together a multi-disciplinary team of practitioners, researchers, and subject matter experts in public health and health systems research and practice, spatial data expertise, health disparities research, community and stakeholder engagement, and health data informatics from UTHealth Houston and The University of Texas MD Anderson Cancer Center. Utilizing this multi-PI governance structure with deep experience in Texas, across the United States, and globally creates a highly-collaborative, solution-focused environment in which learning applied to practice, inclusion of communities, partners, and learners, and capacity building in spatial analysis to advance health are pursued through a team science model:
Co-Directors
- Ryan Ramphul, PhD
- Larkin Strong, PhD, MPH
- Stephanie Nutt, MA, MPA
- Ruth Rechis, PhD
Core Team
- Marcita Galindez, MPH
- Travis Anthony, MSDS
The Joint Collaborative on Geospatial Analysis & Health was founded through a grant from the UTHealth Houston/MD Anderson Cancer Center Population Health Initiative Collaborative Projects Fund. Principal Investigators of the original study were Cici Bauer, Ph.D., Ryan Ramphul, Ph.D., Larkin Strong, Ph.D., M.P.H., and Michael T. Walsh Jr., M.H.A. The collaborative transitioned to the Joint Collaborative on Geospatial Analysis & Health in March 2024.
Community Partners
Engagement of community stakeholders throughout the development of JCoGA&H represents a differentiating feature of this work, as it ensures that the solutions we provide capture and present information that is relevant and accessible to stakeholders who seek to address chronic disease burden and other health challenges. Working in partnership with communities with limited access to services and resources for health, JCoGA&H leverages several key networks comprised of community-based organizations, clinical providers, and public health practitioners. JCoGA&H interacts intentionally with multiple stakeholders across the region and state, as well as nationally, to advance understanding and application of the environment and context where people live, work and play as key factors in understanding and transforming overall health and wellness.
Noteworthy current or recent products, analyses and collaborations include:
- Texas Dashboard for Social Vulnerability (Census Tract)
- Texas Dashboard for CDC Places Data (Census Tract)
- Multi-level Analyses for Prioritized Place-based Community Investments
- Texas Melanoma Stage at Diagnosis and Geospatial Persistent Poverty
- County-Level Social Vulnerability and Breast, Cervical, and Colorectal Cancer Screening Rates in the US, 2018
- Social Determinants of Health (SDOH) and Factors Associated with Delayed Initiation of Treatment for Breast Cancer
- Lymphoma Clinical Trial Participant Mapping Against SDOH and Environmental Factors for Diagnosis
- Texas Health Equity Alliance for Breast Cancer
- Cancer Prevention and Research Institute of Texas (CPRIT) Prevention Program Assessment in partnership with Texas Health Institute
Texas-Specific Dashboard of CDC PLACES Data
Texas-Specific Dashboard of CDC PLACES Data
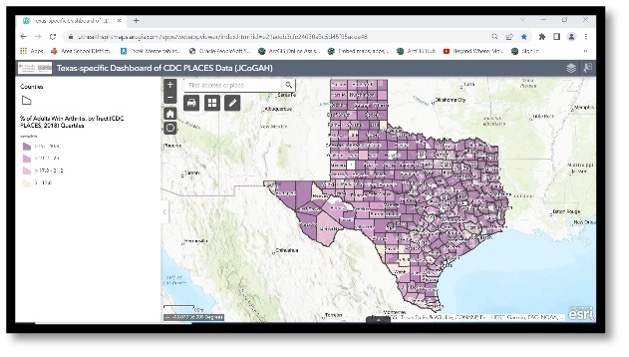 View the Texas-Specific Dashboard of CDC PLACES Data
About the Dashboard
This interactive mapping tool displays the latest CDC PLACES 2022 data for Texas at the census tract level. All measures are grouped into quartiles based on Texas-specific rankings—allowing you to compare each tract only to other tracts within Texas, rather than to the entire United States.
The dashboard is designed to help identify areas with higher chronic disease burdens and vulnerable populations across the state.
Technical Notes
- Best viewing: Desktop or laptop computer with a large screen.
- Recommended browser: Google Chrome.
- Performance tip: The dashboard may take extra time to load the first time, but will run smoothly afterward as your browser cache adjusts.
About CDC PLACES
The CDC PLACES Project provides small area estimates (SAE) for chronic disease–related measures, derived from:
- Behavioral Risk Factor Surveillance System (BRFSS)
- U.S. Census Bureau population data
- American Community Survey (ACS)
The CDC updates PLACES regularly and may expand the dataset in the future to include additional measures based on public health priorities and resources.
Citation
UTHealth Houston–MD Anderson Joint Collaborative on Geospatial Analysis & Health. (2025). Texas-Specific Dashboard of CDC PLACES Data. Retrieved from https://sph.uth.edu/projects/jcogah