UTHealth School of Public Health researchers launch Texas COVID-19 dashboard
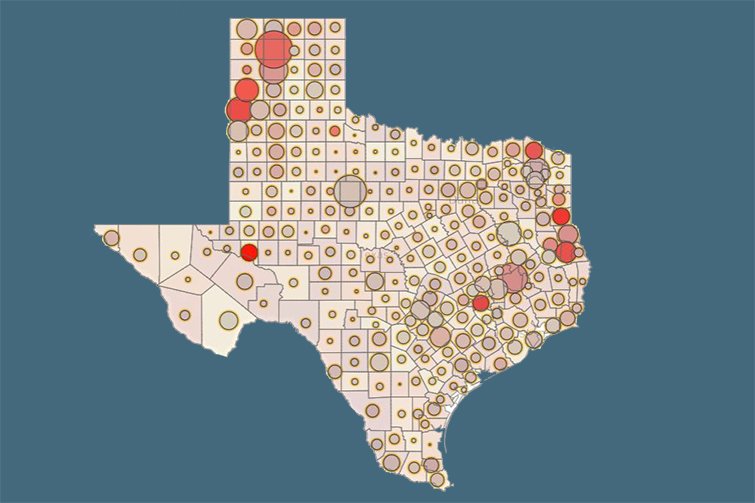
Researchers at the UTHealth School of Public Health recently launched the TexasPandemic.org visualization dashboard, which provides real-time data analytics to monitor COVID-19 spread in the state of Texas. While many dashboards take a high-level view of the available data, the TexasPandemic.org dashboard provides a very intuitive explanation of analyses in much finer detail for Texas counties and metropolitan areas. This makes it an ideal tool to help inform data-driven policies and resource allocation at the local level.
Dr. José-Miguel Yamal, one of the lead developers of the dashboard, explains, “Our aim is to provide Texans with an interactive tool to help identify and understand the trends in their communities so they can plan and respond accordingly. This will be crucial in ensuring the effective management of available resources.”
Researchers source the data for the dashboard from the Texas Department of State Health Services. The state-of-the-art data visualization illustrates basic metrics like the daily number of cases in Texas over time, as well as more abstract, but equally crucial metrics, like the measure of contagiousness, meaning the number of people one COVID-19 positive person is likely to infect. All of the metrics include definitions and context to support the average person’s understanding of the data visualization.
“We have uncontrolled spread of COVID-19 in many communities around the state,” states Dr. Shreela Sharma, professor of epidemiology and member of the dashboard team. “TexasPandemic.org will help identify the current hot spots, predict future spread at the state down to the county level, and will house relevant public health resources, thus effectively informing strategic decision-making to mitigate the spread of the virus.”
Drs. José-Miguel Yamal and Ashraf Yaseen are the lead developers for the TexasPandemic.org dashboard. Collaborators on the project include faculty, students, and staff from multiple School of Public Health campuses and represent the Departments of Biostatistics and Data Science; Epidemiology, Human Genetics and Environmental Sciences; and Health Promotion and Behavioral Sciences. The dashboard is freely available to the public and generously supported by the Department of Epidemiology, Human Genetics and Environmental Sciences.